Many IT services at MAX IV like access to experimental data and computing resources need a VPN and other authentication tools. It is strongly recommended that users install and familiarize themselves with all the necessary tools before arriving at MAX IV.
Accessing raw data
Globus and sftp can be used to transfer data from MAX IV experimental storage to personal devices. If accessing from any of the beamline computers, all data files can be found in the MAX IV data storage in the location:
/data/visitors/balder/<Proposal-ID>/<Visit>/
<Proposal-ID> can be seen in DUO. <Visit> is the date-time YYYYMMDDHH at the start of your beamtime session. Only users added to the session in DUO will have access to the data files. Raw data are stored as HDF5 files. We recommend silx viewer to view raw data files. Additionally, for reading raw data into python scripts, h5py and hdf5plugin packages are needed.
XAS Data
Structure of raw data files
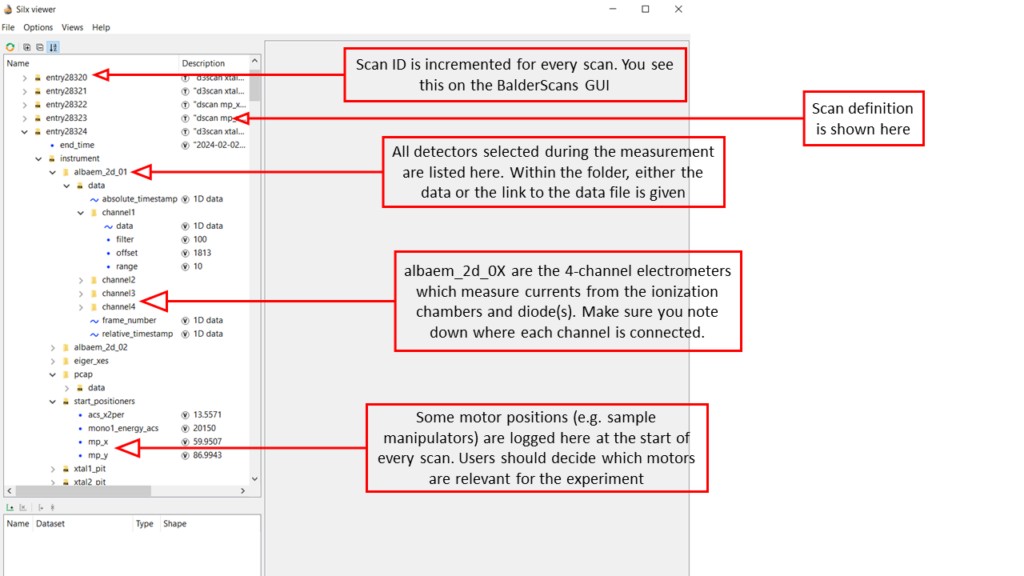
The control system at Balder creates a Master HDF5 file (with .H5 extension) which contains the definition of every scan, the list of detectors included in the measurement group, settings for (most of) the detectors and links to the respective external data files. Every detector like the Alba electrometers (which measure currents from the ionization chambers and diodes) or the Xspress3 (which measures energy resolved fluorescence) creates its own HDF5 files that are linked to the Master file. Typically for XAS measurements, relevant spectra are extracted automatically into individual column files in text format which can be directly loaded into analysis packages like Demeter. Hence, in some cases, users may not need to deal with the raw .H5 files.
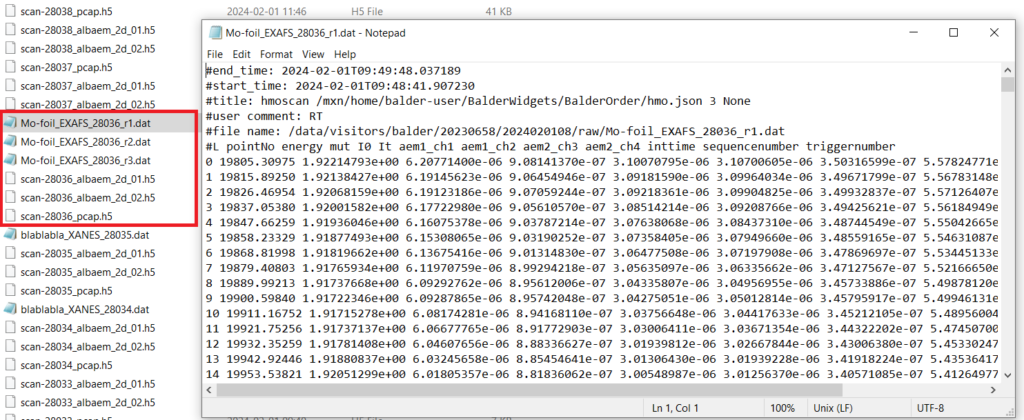
The structure of the master file is also shown below. PCAP refers to the hardware device within the PandABox used at Balder which captures and stores energy and acquisition time data (which is important for normalizing fluorescence counts).
XRD Data
XRD at Balder is measured using an EIGER 1M detector. The detector is mounted on a robotic arm and placed at a fixed position during an experiment. The calibration is performed using a standard (like LaB6) and a PONI file is generated.
Raw images from the EIGER 1M detector are available by default for post-processing. In addition, the PONI file is used by an online data reduction pipeline which uses azint for performing azimuthal integration of powder diffraction patterns. The files with reduced 1D data are stored in the location '/process/azint/' within your data directory. Data reduction can also be performed offline using azint available on the MAX IV cluster using Jupyter Notebooks or even on personal computers using azint or PyFAI.
Data Analysis Tools
Jupyter Notebooks
We have developed Ipython based Jupyter Notebooks which run on the MAX IV HPC cluster to enable handling large volumes of data which is typical for many in-situ and operando experiments at Balder. The notebooks can be easily customized to the needs of every experiment and are available to the users for data analysis during and after the beamtimes. The access to these notebooks are through standard web browsers using a VPN and thus eliminate the need for local python installations or transfer of large chunks of data. More information on usage of Jupyter at MAX IV is available here.
ParSeq
ParSeq is a python software library for Parallel execution of Sequential data analysis. Separate interfaces exist for analysis of XAS and XES data. It is recommended to run the program on Anaconda. Instructions for installing ParSeq on personal computers are given below. Disclaimer: The following has been tested on Windows and Linux machines, but not extensively on Mac.
- Installing Anaconda and creating a new environment
- Anaconda distributions for different OS are available at anaconda.com
- There is a cheat sheet available online with a handy list of basic commands when it comes to using conda: https://docs.conda.io/projects/conda/en/latest/user-guide/cheatsheet.html
- Once the installation is complete, open Anaconda Prompt (which is a terminal like the windows command prompt). It should open a prompt.
- If the environment is set to
(base), we need to deactivate it with the command:conda deactivate - Now you need to create a new environment. Let’s call it
‘parseq_env’. The command to create this new environment is:conda create --name parseq_env - We can activate the newly created environment now:
conda activate parseq_env
- Installing ParSeq
- Download the source code of the core package from the github distribution: https://github.com/kklmn/ParSeq. Click on the
<> Codebutton on the page and download a zip file. - In the anaconda prompt, install pip with the command:
conda install pip. Pip is a package installer for python (conda installer can also be used; however, this is sometimes cumbersome to use for parseq). - Navigate to the location of the parseq distribution ParSeq-master.zip. Install the package using command:
pip install ParSeq-master.zip. - Ideally this should also install all dependencies. However, it can happen that some packages are not installed automatically. You should get an error message when trying to launch ParSeq with instructions on which packages are missing and sometimes also how to install them. Some usual culprits are: PyQt5, PyQt6, PySide6 and pyqtwebengine. To be safe, install all of the above individually using commands:
pip install PyQt5and so on..
- Download the source code of the core package from the github distribution: https://github.com/kklmn/ParSeq. Click on the
- Download the XAS (or XES) package from github
- We have installed the core package, and can now download the package corresponding to our measurement technique: https://github.com/kklmn/ParSeq-XAS. Download the zip file as before and extract the files to a local directory. In the anaconda prompt, navigate to the extracted parseq_XAS directory. It should contain several python scripts including one called XAS_start.py. Launch this script from the prompt:
python XAS_start.py. - If the GUI fails to open, read the error messages in the terminal window and follow the instructions to install any missing packages. Otherwise, you’re now ready to use ParSeq for data analysis.
- We have installed the core package, and can now download the package corresponding to our measurement technique: https://github.com/kklmn/ParSeq-XAS. Download the zip file as before and extract the files to a local directory. In the anaconda prompt, navigate to the extracted parseq_XAS directory. It should contain several python scripts including one called XAS_start.py. Launch this script from the prompt: